COURT INDEXPLAYOFFS · EP. 2

THE REVIEW · PART 1

Enter the
film room.

Soundtrack on. Numbers verified. Opening night, re-cut through the possessions that mattered.

This click starts music.mp3 and opens the issue.

VERIFIED GAME 1 REVIEW · BEST OF 5

EP. 2

The reviewpart 1

Two close games, two 1–0 leads, and a cleaner view of what actually decided opening night.

All figures are derived from the supplied team-comparison and box-score screens. DNP rows are excluded from player usage.
OPENING NIGHT2VERIFIED REVIEWS
GAME 1 · EMPIRE LEAD 1–0EAST
CHICAGO107
FINAL
NEW YORK109

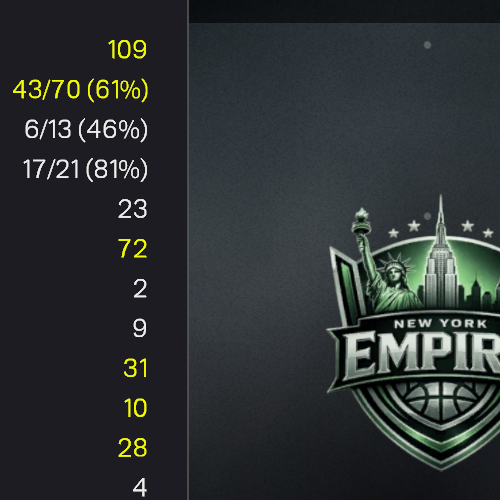
New York: +16 paint points, +12 total rebounds, +9 dunks.

GAME 1 · JOKERS LEAD 1–0WEST
OAKLAND138
FINAL
LAS VEGAS143

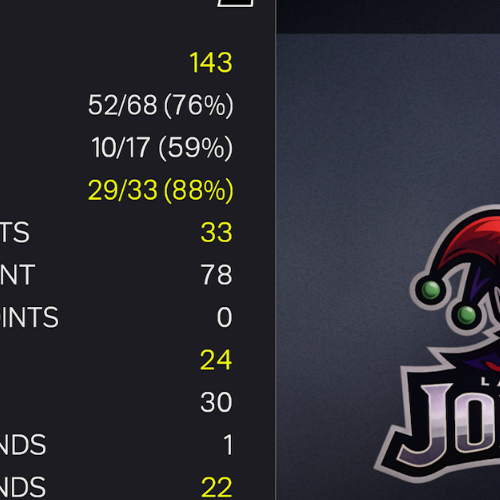
Las Vegas: +11 free-throw points, +13 bench points, +8 fast-break points.

CHICAGO USED 7 PLAYERSOAKLAND USED 8 PLAYERSLAS VEGAS USED 8 PLAYERSNEW YORK PLAYER USAGE NOT SHOWN IN THE SUPPLIED BOX SCOREBEST OF 5 · GAME 2 HAS OUTSIZED LEVERAGE

THE GAME 1 DESK

What the scores concealed.

Chicago lost by two despite a major turnover advantage. Oakland lost by five despite 138 points. The reasons sit in possession quality, interior control and where the scoring came from.

GAME 1 REVIEWEMPIRE LEAD 1–0
Chicago Cyclones logoCHICAGOCYCLONES
107FINAL109
New York Empire logoNEW YORKEMPIRE
New York converted interior control into a two-point win.

Chicago won the turnover battle. New York won the available-rebound battle.

Chicago committed only five turnovers and posted a 62.9% effective field-goal rate. New York answered with a 32.3% offensive-rebound rate, 72 paint points and 21 dunks.

5.9% CHI TOV%32.3% NY OREB%66.1% NY paint share39 Russell points
GAME 1 REVIEWJOKERS LEAD 1–0
Oakland Sea Lions logoOAKLANDSEA LIONS
138FINAL143
Las Vegas Jokers logoLAS VEGASJOKERS
Las Vegas won the scoring-source battle.

Oakland generated elite offense. Las Vegas generated the more valuable offense.

Oakland produced 82 paint points and assisted 75.9% of its made field goals. Las Vegas paired an 83.8% effective field-goal rate with 29 made free throws and 24 bench points.

86.6% LV TS%48.5% LV FT rate75.9% OAK AST/FGM44 Pope points

VERIFIED ROTATION USAGE

DNP means zero game usage.

Only players with a recorded minute total are counted as having played. This corrects the earlier rotation language.

CHICAGO7 PLAYERS USED
DNP in supplied screen: Joemar Samson, Ludwig Groß, Sterling McKnight Chandler, Kyrie McKenzie, Francesco Forgione.
OAKLAND8 PLAYERS USED
DNP in supplied screen: Joao Cabral. The supplied screen cuts off any rows below Cabral, so no claim is made about names not visible.
LAS VEGAS8 PLAYERS USED
DNP in supplied screen: Hooper Flagg. The supplied screen cuts off any rows below Flagg, so no claim is made about names not visible.
NEW YORKTEAM DATA ONLY

No New York player box-score screen was supplied for Game 1. Team totals are verified; individual minutes and rotation count are not.

This site deliberately leaves the player-usage field blank rather than infer it.

ADVANCED METRICS

Possession value, not decorative numbers.

Metrics are calculated from the supplied totals. Custom composites are labeled as such; no tracking-only metric is estimated.

EAST · GAME 1

Chicago vs New York

NY +2
EST. POSSESSIONS80.5game average
OFF. RATING133.0 / 135.5CHI / NY
AST / FGM62.5 / 72.1CHI / NY %
WEST · GAME 1

Oakland vs Las Vegas

LV +5
EST. POSSESSIONS89.3game average
OFF. RATING154.5 / 160.1OAK / LV
BENCH SHARE8.0 / 16.8OAK / LV %
CUSTOM COMPOSITE

Interior pressure share

Paint points plus made free throws as a share of total scoring.

CHI 70.1%NY 81.7%
New York sourced a larger share of its offense from paint scoring and made free throws.
CUSTOM COMPOSITE

Interior pressure share

Paint points plus made free throws as a share of total scoring.

OAK 72.5%LV 74.8%
The gap was small; Las Vegas’ larger free-throw contribution supplied the difference.
SHOT CREATION

Assist-to-made-field-goal rate

Team assists divided by made field goals.

OAK 75.9%LV 57.7%
Oakland’s scoring was more assist-dependent; Las Vegas produced more unassisted or self-created makes.
FINISHING PROFILE

Dunks per made field goal

Recorded dunks divided by made field goals.

CHI 30.0%NY 48.8%
Nearly half of New York’s made field goals were recorded as dunks.

D2 DECISION MAPS

Evidence-based changes to consider.

These are conditional basketball responses tied directly to Game 1 results and the previously supplied player attributes. They are not claims about unobserved possessions.

01
CHICAGO RESPONSE MAP

Preserve ball security; reduce New York’s interior volume.

5 TO53%72 PIPKEEPCHANGE

Keep: Chicago’s five turnovers and 53.3% three-point shooting were verified strengths.

Consider: More lineups with Davis and the strongest available rebounders when New York’s interior group is on the floor; New York had a 32.3% OREB rate.

Watch: Scott shot 3-of-13. Any added creation role should be judged against shot quality and turnover control, not assumed to help automatically.

02
OAKLAND RESPONSE MAP

Keep the eight-man group; change the scoring exchange.

41 AST82 PIP29 FTM33 FBPKEEPCHANGE

Keep: Oakland’s eight players produced 138 points, 41 assists and 82 paint points.

Consider: Lineup and coverage choices aimed at reducing transition and fouling; Las Vegas scored 33 fast-break points and made 29 free throws.

Watch: The bench gap was 24–11. Oakland does not need a shorter rotation than Game 1; it needs more production or better matchup outcomes from the existing eight.

PLAYER EFFICIENCY

Verified high-impact lines.

True shooting includes field goals, threes and free throws. Values can exceed 100% because three-point makes are worth more than two points per field-goal attempt.

FACT CHECK & METHOD

What is known—and what is not.

The review avoids tracking claims, lineup combinations and player participation that are not visible in the supplied material.

Verified sources

  • Team-comparison screens for both Game 1 matchups.
  • Chicago, Oakland and Las Vegas player box-score screens.
  • Previously supplied player attributes and badge tables for tactical context.

Not supplied

  • New York’s Game 1 player box score and minutes.
  • Play-by-play, shot locations, lineup combinations or possession timestamps.
  • Tracking data such as defender distance or expected field-goal percentage.

Formulas used

  • eFG% = (FGM + 0.5 × 3PM) ÷ FGA.
  • TS% = PTS ÷ [2 × (FGA + 0.44 × FTA)].
  • Estimated possessions = FGA + 0.44 × FTA − OREB + TO.
  • OREB% = OREB ÷ (OREB + opponent DREB).