CHICAGO107
FINALNEW YORK109
New York: +16 paint points, +12 total rebounds, +9 dunks.
THE REVIEW · PART 1
Soundtrack on. Numbers verified. Opening night, re-cut through the possessions that mattered.
This click starts music.mp3 and opens the issue.
BUILDING THE FILM ROOM
VERIFIED GAME 1 REVIEW · BEST OF 5
Two close games, two 1–0 leads, and a cleaner view of what actually decided opening night.
New York: +16 paint points, +12 total rebounds, +9 dunks.
Las Vegas: +11 free-throw points, +13 bench points, +8 fast-break points.
THE GAME 1 DESK
Chicago lost by two despite a major turnover advantage. Oakland lost by five despite 138 points. The reasons sit in possession quality, interior control and where the scoring came from.
 CHICAGOCYCLONES
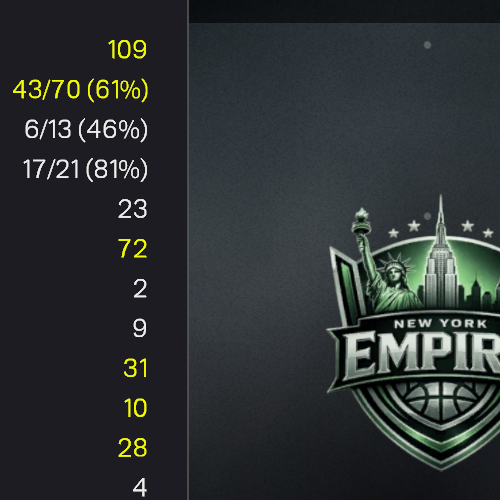 NEW YORKEMPIRE
Chicago committed only five turnovers and posted a 62.9% effective field-goal rate. New York answered with a 32.3% offensive-rebound rate, 72 paint points and 21 dunks.
 OAKLANDSEA LIONS
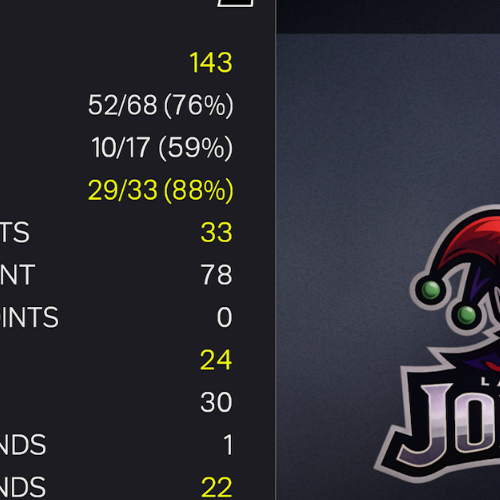 LAS VEGASJOKERS
Oakland produced 82 paint points and assisted 75.9% of its made field goals. Las Vegas paired an 83.8% effective field-goal rate with 29 made free throws and 24 bench points.
VERIFIED ROTATION USAGE
Only players with a recorded minute total are counted as having played. This corrects the earlier rotation language.
No New York player box-score screen was supplied for Game 1. Team totals are verified; individual minutes and rotation count are not.
ADVANCED METRICS
Metrics are calculated from the supplied totals. Custom composites are labeled as such; no tracking-only metric is estimated.
Paint points plus made free throws as a share of total scoring.
Paint points plus made free throws as a share of total scoring.
Team assists divided by made field goals.
Recorded dunks divided by made field goals.
D2 DECISION MAPS
These are conditional basketball responses tied directly to Game 1 results and the previously supplied player attributes. They are not claims about unobserved possessions.
Keep: Chicago’s five turnovers and 53.3% three-point shooting were verified strengths.
Consider: More lineups with Davis and the strongest available rebounders when New York’s interior group is on the floor; New York had a 32.3% OREB rate.
Watch: Scott shot 3-of-13. Any added creation role should be judged against shot quality and turnover control, not assumed to help automatically.
Keep: Oakland’s eight players produced 138 points, 41 assists and 82 paint points.
Consider: Lineup and coverage choices aimed at reducing transition and fouling; Las Vegas scored 33 fast-break points and made 29 free throws.
Watch: The bench gap was 24–11. Oakland does not need a shorter rotation than Game 1; it needs more production or better matchup outcomes from the existing eight.
PLAYER EFFICIENCY
True shooting includes field goals, threes and free throws. Values can exceed 100% because three-point makes are worth more than two points per field-goal attempt.
FACT CHECK & METHOD
The review avoids tracking claims, lineup combinations and player participation that are not visible in the supplied material.